10 minutes
Malware Traffic Analysis (My thought Process)
Hello blue teamers, this is my first traffic analysis writeup for my future reference and also to document my self-learning journey in Cyber Security, so I will keep this short and simple while going through how i approached this Wireshark network packet capture (pcap) file.
(Remember , through this write-up, i am talking to me, my future self. If any random people reads it, forgive me for any mistakes. Enjoy! )
For those of you who does not know what Wireshark is or are new to this field :
Wireshark is an open-source network protocol analyzer and packet capture tool. It is used for troubleshooting, analysis, development, and education in the field of network protocols and communications - source: google.
This exercise is done from this website https://www.malware-traffic-analysis.net/.
I will go through my thought process by doing a traffic analysis of a pcap file.
"^" symbol here signifies that this particular section is skippable.
TRAFFIC ANALYSIS - FUNKYLIZARDS (2021-08-19
THE SCENARIO
So we are given a pcap file and and LAN segment data in the website. The LAN segment data signifies our host IP range. There is also the domain name and domain controller given, which is , for this exercise are, funkylizards.com and 110.8.19.8 - Funkylizard-DC respectively
THE ANALYSIS
Endpoints & Conversations:
After opening the file , we are presented with this:
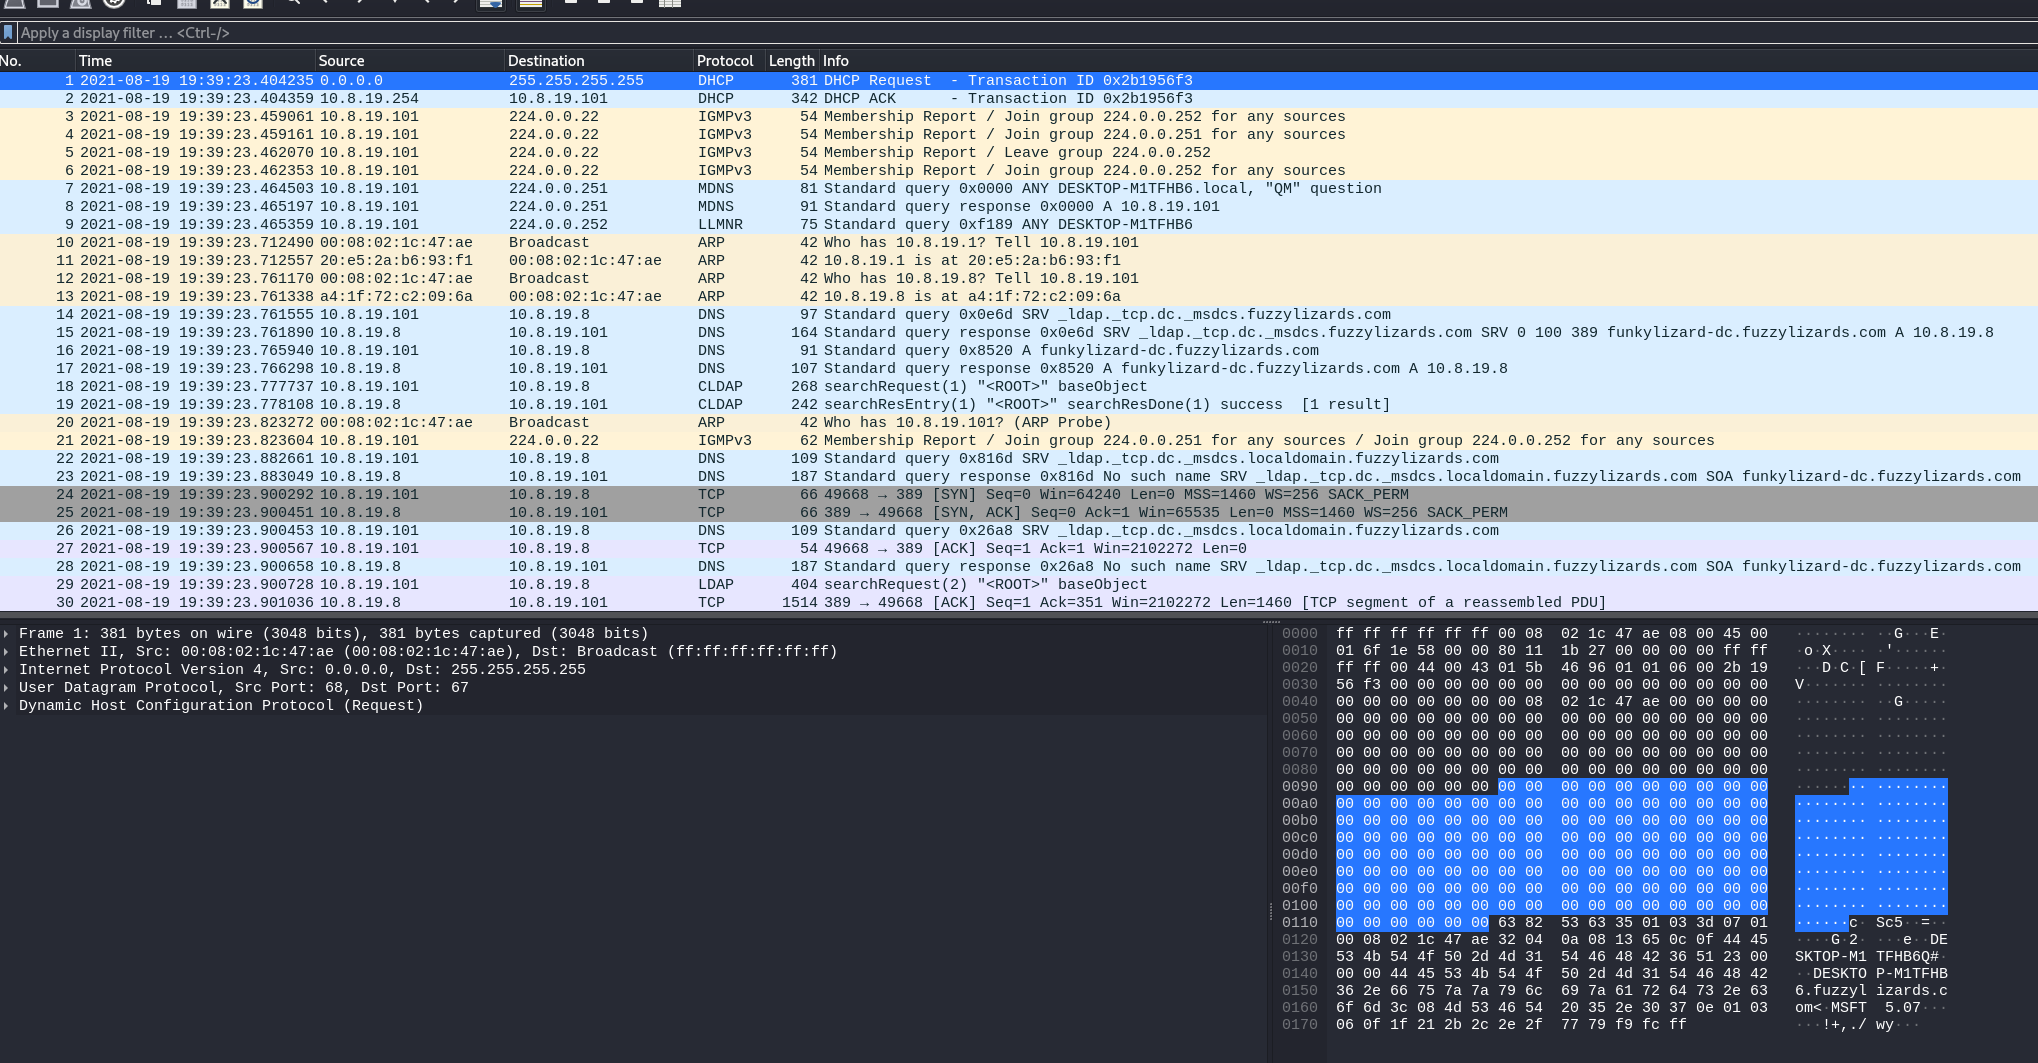
I know, this is all just too much information and noise . What is going on ?, But hold still.
Before we began the actual analysis , I always like to go to the Endpoints and Converstations view of Wireshark. It’s under the ‘Statistics’ tab :
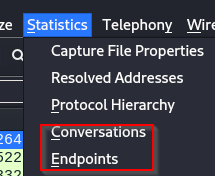
It gives us a clear picture of the communication that has been taking place, to what endpoint device the communication is going , from where is it coming and how much information transfer is happening. It really helps us to narrow down our analysis so we don’t have to hit our heads in the wall and gives us a general idea of what is going on. “Endpoints” & “Conversations” are both great but if you ask me , i usually go check and spend my time more on “Conversations” tab.
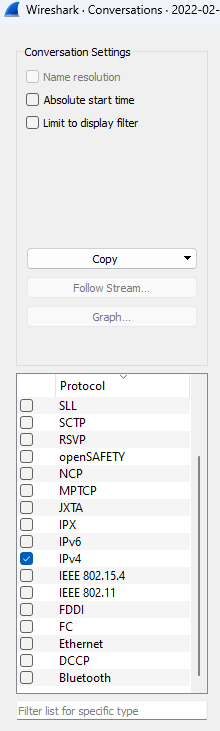
But before we can analyze further, don’t forget to tick only IPv4 under the protocols tab on the left side of the “Conversations” window. This will narrow our search down further, which will greatly help us on our analysis.
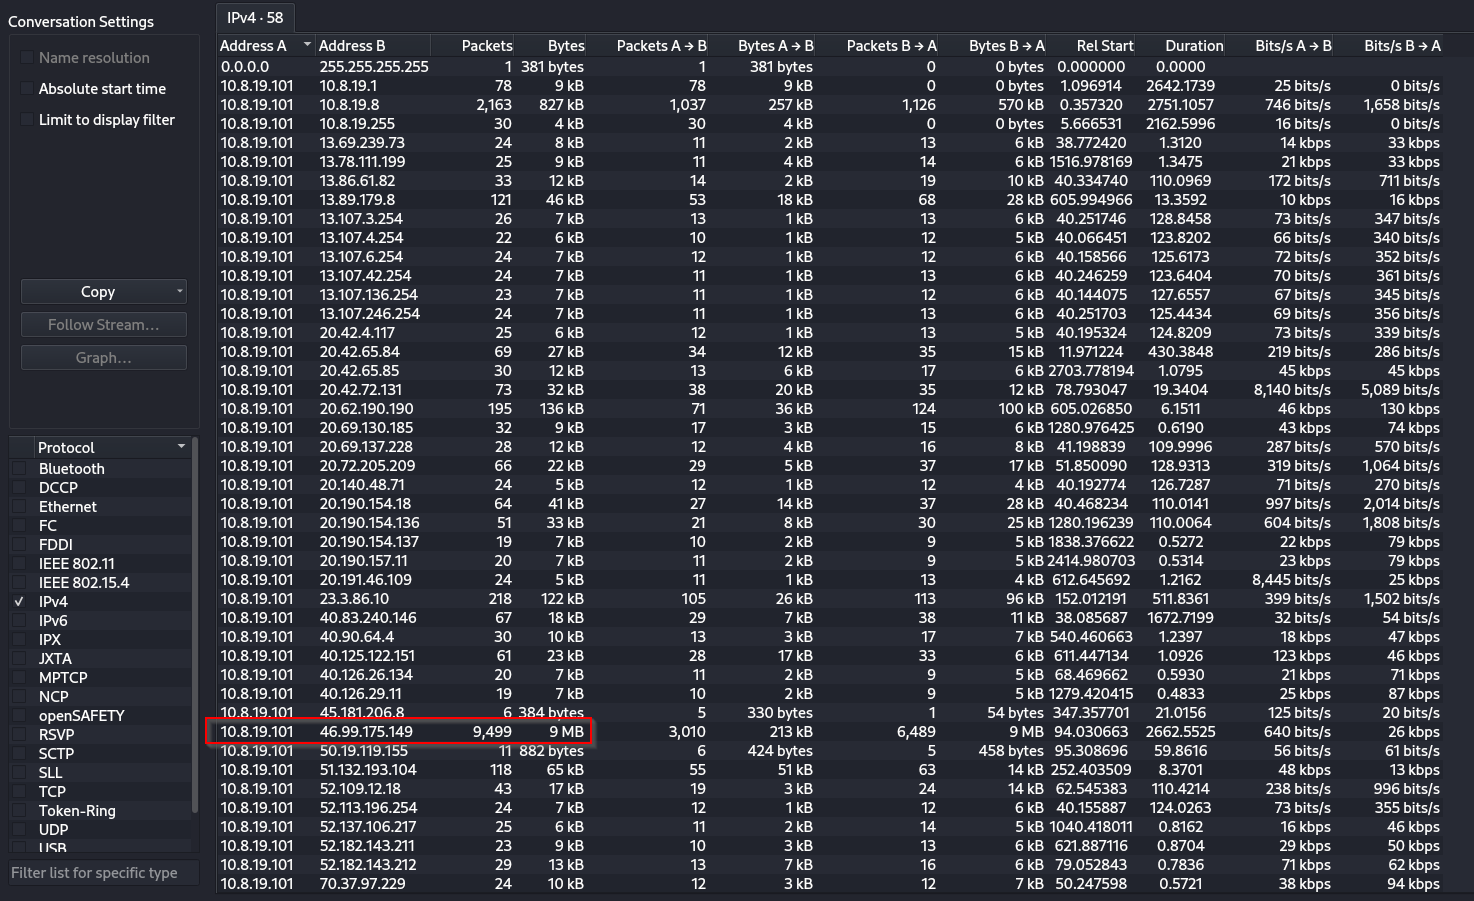
As we can see below , there is a recurring IP in Address A. This is must be the host IP and we can also see the highest packet size that is happening between our host IP and an unknown IP 46.99.175.149, hmm seems suspicious. Here our curiosity intuition should kick in and we must note it down. We can also apply that IP address as a filter which will allow us to look at the packets based on the protocol.
To do that:
- right click on the IP and :
 This will show us the packets and at which protocol the transfer happened. However in this case, it was a miss. The protocol was TCP and not much information was there for me to move further so I left it there. A http would have been nice, but no matter.
Based on this info , we can also note down the IOC (indicators of compromise) as that IP address.
The Filters:
After opening the pcap file, I usually get this ephemeral fear by lookin at all those different protocols and layers. But once i click the filter section and apply the http filter, everything falls into place.
I like to look at the packets from a higher level in the OSI/TCP/IP model, since http comes under the Application layer of the TCP/IP model, everything just makes sense and you can see requests and response directly without much noise.
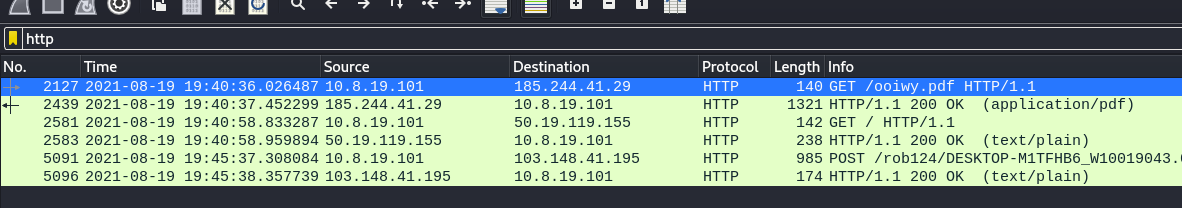
Below , you can see the http filtered results from that pcap file. So clean! :
I would like to pause our analysis for a moment and would like to explain what the above picture means to an average joe.
Time: At the left side we can see the time in UTC format. It is said that the all reports should be in UTC format for readability so I have changed it to UTC in the wireshark settings. Default time settings of wireshark is different.

Source: This indicates our source ip, which in this case , is our victim host ip.

Destination: This indicates the ip address that our host is going to.

Protocol: HTTP in the application layer for extreme readablity and enjoyment.

Length: Self explanatory. Describes the volumn of data transferred.

Info: Types of HTTP req being made eg GET/POST followed by the actual resource and other information.


Summary: Reading the first Req--->
			On 2021-08-19 at approx 19:40 UTC this IP(10.8.10.101) requested
			for a /ooiwy.pdf file located at this destination 185.244.41.29
			Since the host is requesting something from a server or a different ip address, it is called a GET req. If the host would want to put something on that server or trasnfer something to that server maybe a file or edit a file, it would be a POST req.

			GET and POST requests are the most common types of requests you will find in wireshark.
Tip : You can select any filter (http or tcp) then use the “Conversations” tab to get even more narrowed and filtered results which will greatly reduce the time taken to analyze and give you a more clearer picture of the whole scenario. You have to try it out for yourself to get a feel for it, you will see the difference.
We immediately see GET requests and also one POST request, interesting. Lets look into the first GET request. Its asking for a file named ooiwy.pdf.
Lets put our hacker googles on and further investigate it.
The Deep analysis:
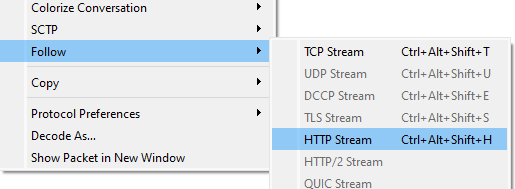
We can right click on the request and then follow it to HTTP stream. This will allow us to see inside of that particular pdf file, but the information will be scrambled.
As we can see below, this is what the inside looks like:
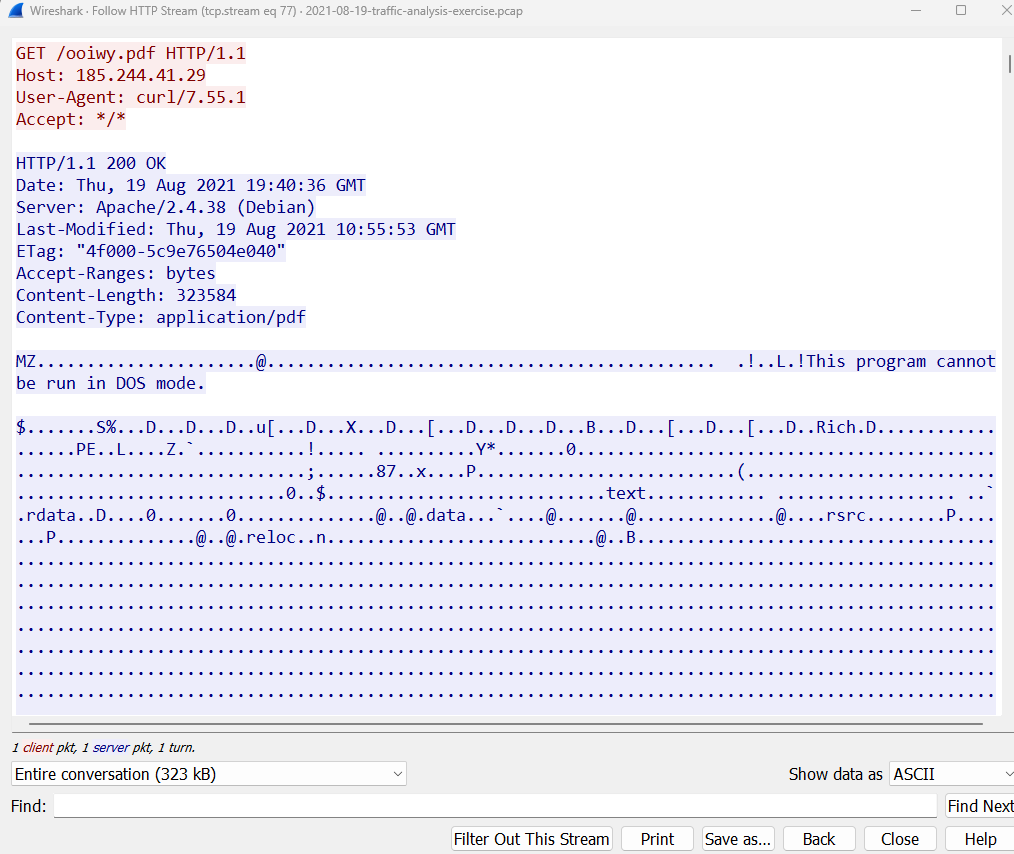
The data is all noisy except for one very important thing, and this really puts a smile on my face. This part below is a clear indicator that this pdf file, in reality is not actually, a PDF file.
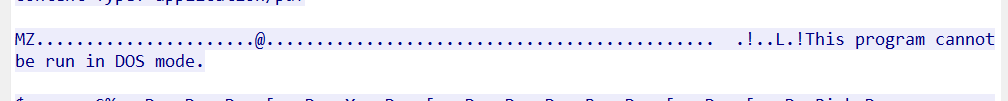
‘MZ.....@...!! This program cannot be run in DOS mode’
Whenever you see this writing, be clear that this is a PE (portable executable) file that is made to run on Windows Operating system. Which is indicative that this is a suspicious file that is designed to bring death and destruction to your windows machine.
Interesting fact:
The "MZ" is a signature of a Portable Executable (PE) file. It is located at the beginning of the file and indicates that the file is a PE file.
also,
The "MZ" signature is made up of the initials of Mark Zbikowski. He was one of the developers of the original MS-DOS executable file format. The letters "MZ" are also the hexadecimal characters 4D 5A, which are found in the first two bytes of the file.
Now , we can do one thing, we can further analyze this PE file by exporting it to our VM/local machine. I advice exporting it to your VM since we don’t the nature of the file. To export the file / artefact , click file, export objects as HTTP. Follow this:
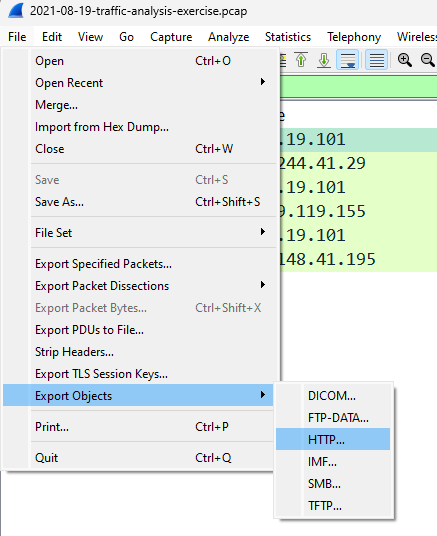
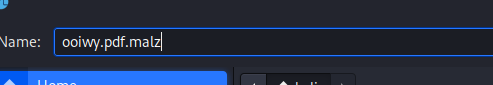
Now you will be presented with an object list of what you want to export. Here, select the pdf file and save it as ooiwy.pdf.malz.
I will put a .malz extension before saving it to my VM or host for extra safety measure.
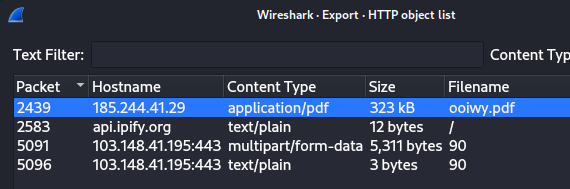
Save it where ever you want.
Note: You will not always find objects/files to export from your pcaps. So in times like this , just skip the “Exported File Analysis” section in the blog. Otherwise if you manage to export a file or two, read the “Exported File analysis” section, but i suggest to read through the section anyways as you will only learn more. Nothing wrong with learning more , amirite??
After you have read the “Exported File analysis” section, meet me here again.
Lets analyze the POST request now: Same drill as before, follow the http stream and see if you get any juicy details and/or export http to your machine .
I choose to export it….
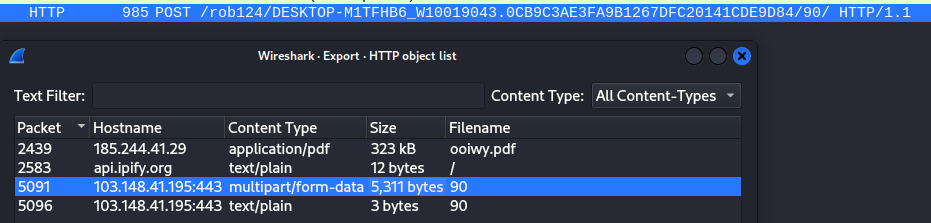 filename 90. No extension given.
After exporting files like this , i always run “
filename 90. No extension given.
After exporting files like this , i always run “strings” command to it. Because i am afraid of running it.
Found this :
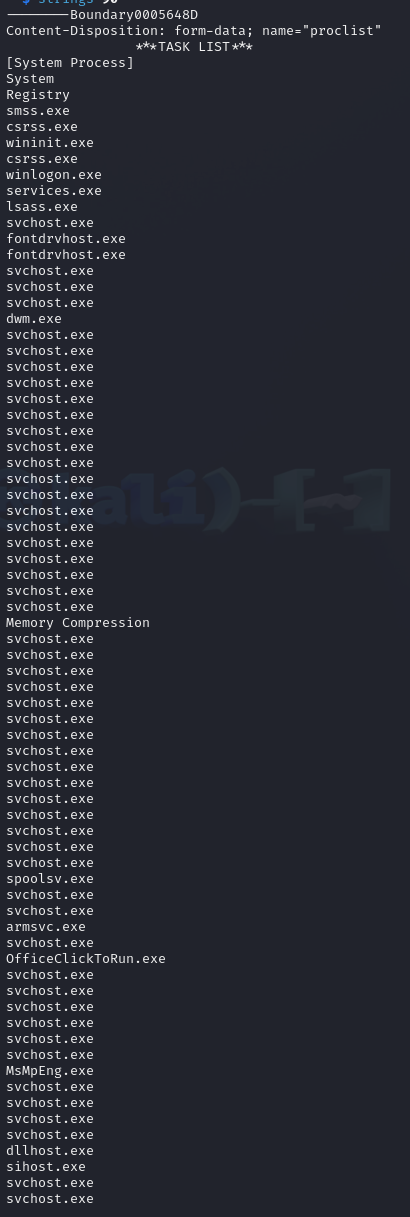 A huge list of running processes of the victim’s machine
And also this:
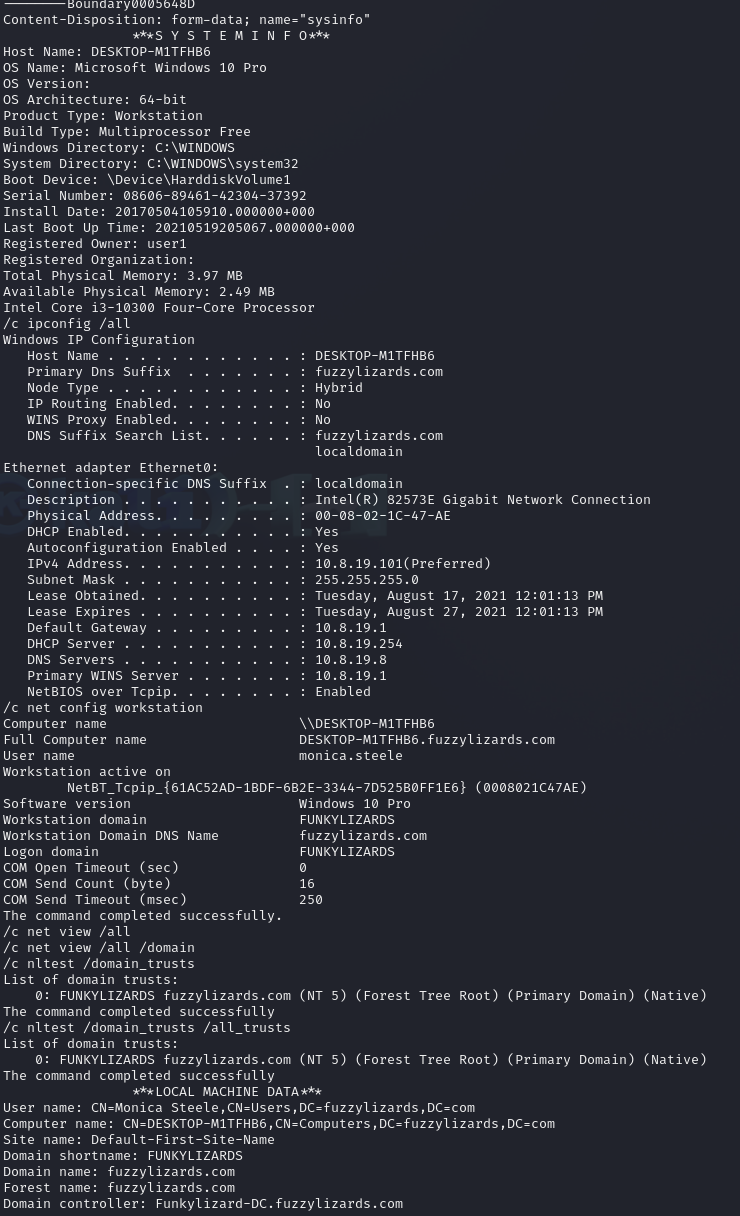
The System Info of the host . Here we can see all kinds of info, the hostname, username of host , machine specifications, MAC address, OS etc.
And all of this information was being sent to the destination ip 103.148.41.195:443 on https since this is a POST req. Also remember there was a mention of a TRICKBOT malware in the #Exported File Analysis section. This is what a Trickbot malware does, it steals information.
From google : TrickBot is a banking Trojan that was first identified in 2016. It is a modular malware that can perform a variety of illicit operations, including:
- Stealing credentials, data, and personal information
After conducting this very long investigation, We can finally come to the conclusion and can summarize the report.
^Exported File Analysis ( First Timers READ THIS)
(skip this if no exportable objects are present)
After exporting the malicious PE file, you want to extract the hash.
Open command prompt or terminal and type:
sha256sum <your malware file>
The hash file will magically appear in your terminal. Now I want you to take that hash string and go to VirusTotal (https://www.virustotal.com/gui/home/search). A great site to analyze those pesky little malwares hashes , urls and other files. It will provide you with information and tell you if it is malicious or not.
In our case , it is a direct HIT!
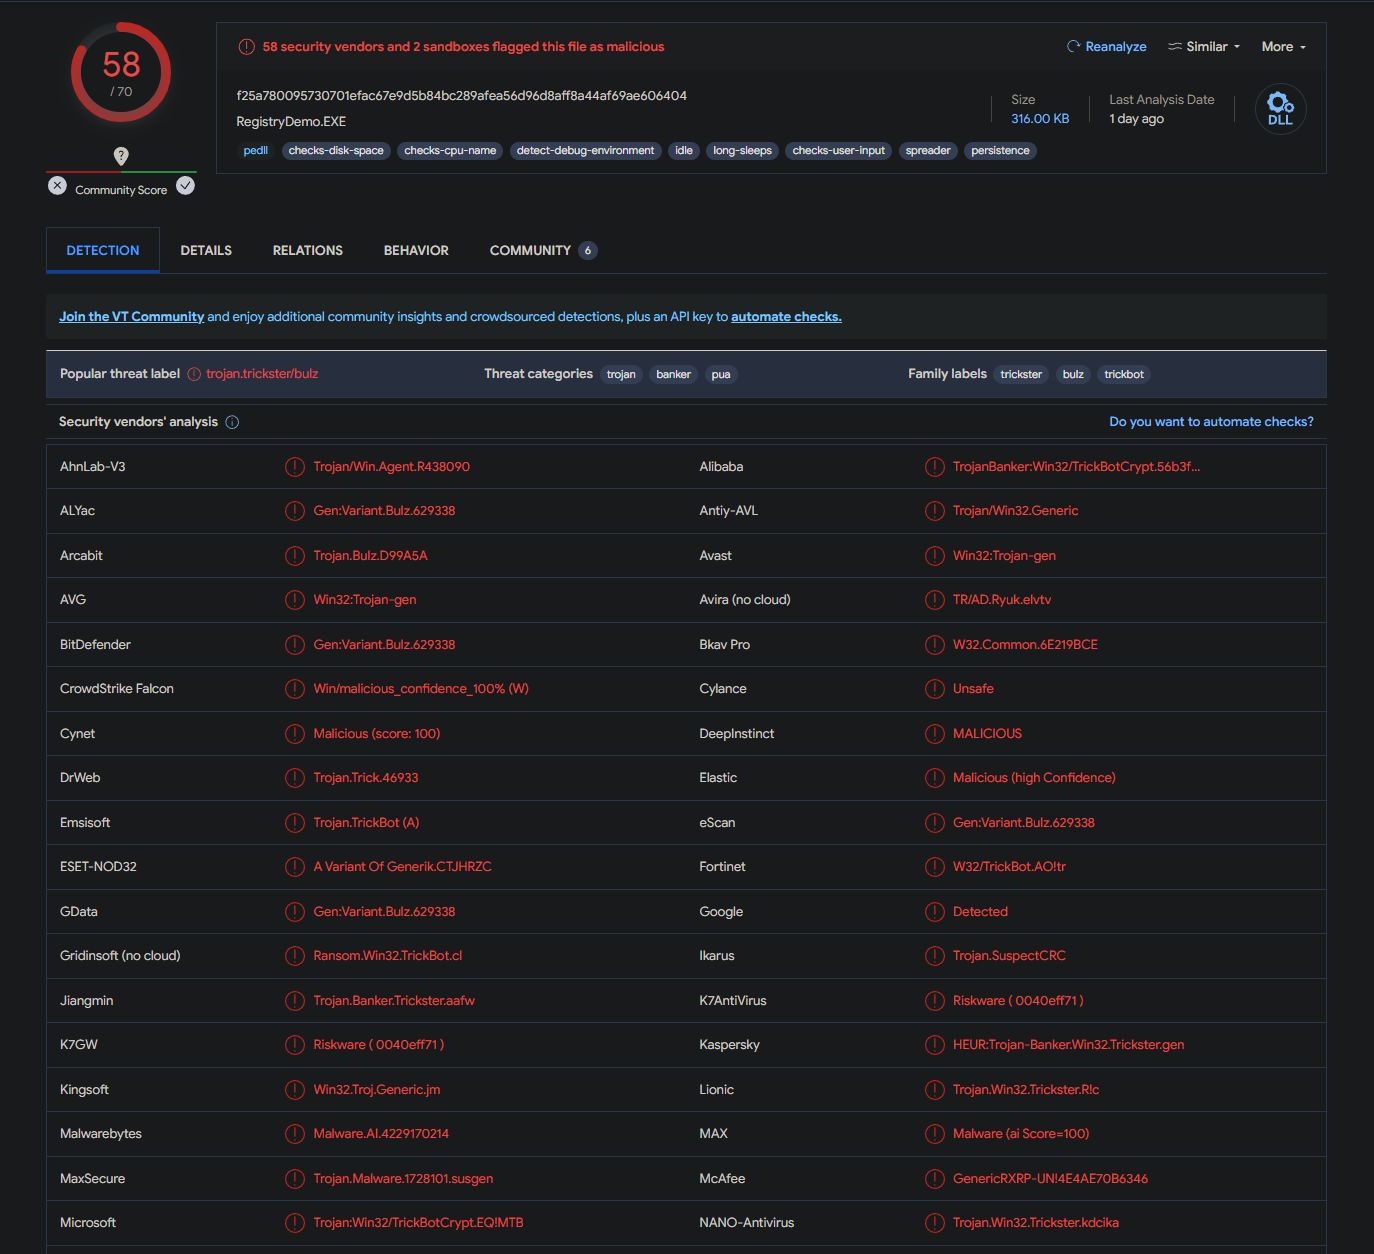
Ahh all red, fireworks in my eyes. Great work.
In the results there are several mentions of a TrickBOT. Keep this info in your mind. You can further explore other tabs of virusTotal if you want.
So , now we know that this ooiwy.pdf file is a malware. And the host downloaded it to their workstation. We don’t know what is the malware is supposed to do. But remember, I told you to keep “TRICKBOT” in mind. A quick google search explains what a trickbot malware does.
However ,lets not get ahead of ourselves and analyze our next POST req. We still have work to do in wireshark.
Lets get to the “exported file analysis” section now, and will be back here if more exportable objects come.
The Conclusion:
Executive Summary:
On 2021-08-19 at approximately 19:40 UTC, a Windows host used by Monica Steele was infected with Trickbot malware.
That’s it folks , I know this turned out to be huge analysis , but it was important for me to go through all of my thought process as this was my first blog post, well first technical post. My upcoming posts will be shorter, i promise :)
When i see a pcap file, i usually follow all the steps mention in this post, with some slight modifications based on my initial assessment of the pcap file. Here your intuition will help you and the pattern recognition. The more you do this type of exercises the more you will instinctively try to do what you are trying to do. I hope you get me.
Cheers , never stop learning and once again i will say, this blog post was written to help me , my future self , so if anyone other than me is reading this , i hope you learnt something new , even if it was only 1%, its enough.
Until next type, adios!
1990 Words
2024-01-31 22:15